
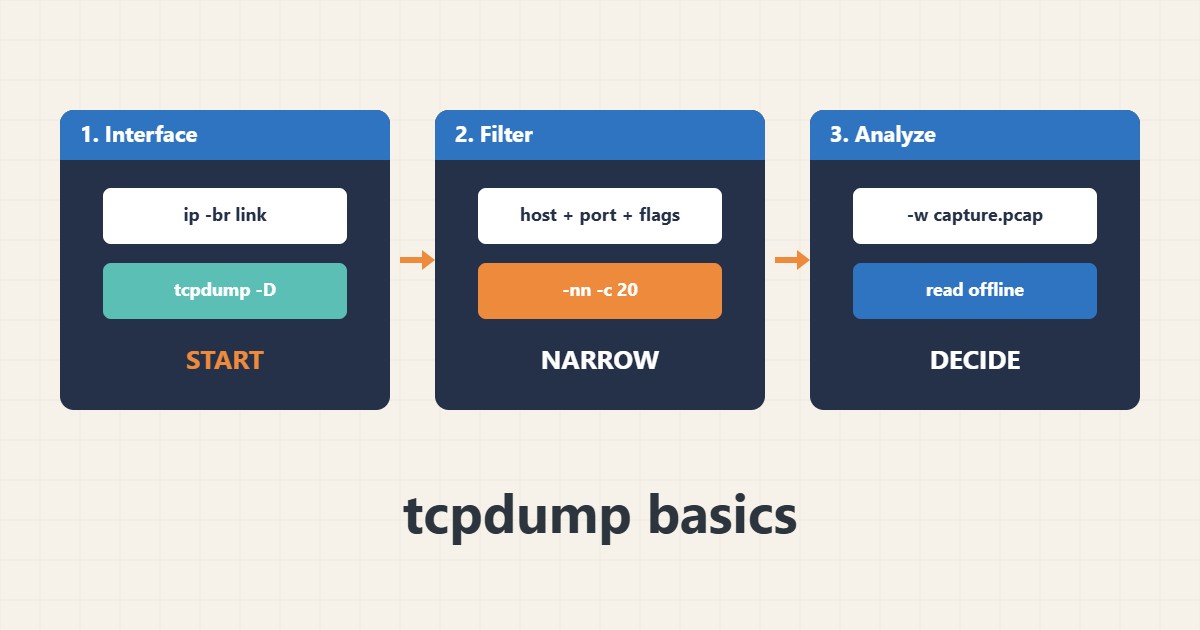
When logs do not explain a network problem, tcpdump shows what actually crosses the wire: whether a request arrives, whether a reply leaves and who resets the connection. It is powerful and risky: a careless capture can fill the disk, hide the real traffic in noise or store private data. This guide shows narrow, time-limited captures. Commands follow the tcpdump documentation; I did not run them on your server, and you need root or the capture capability and the owner’s permission to capture traffic.
1. Find the interface and start small
Identify the right interface and capture a handful of packets without name lookups:
ip -br link                       # find the interface name
sudo tcpdump -D                    # list capture interfaces
sudo tcpdump -i eth0 -nn -c 20 port 80   # 20 packets, no name lookups
For general port checks see the file and process search guide and the firewall rules in the firewall guide.
2. Filter by host, port and flags
Filters keep the output readable. Combine host, port and TCP flags:
sudo tcpdump -i eth0 -nn host 203.0.113.10 and port 443
sudo tcpdump -i any -nn 'tcp port 3306 and not host 127.0.0.1'
sudo tcpdump -i eth0 -nn 'tcp[tcpflags] & (tcp-syn|tcp-rst) != 0'
SYN and RST flags help you see refused or reset connections.
3. Save a limited capture
Always limit time, packet count and snapshot size, then read the file offline:
sudo timeout 60 tcpdump -i eth0 -nn -s 128 -c 5000 -w /tmp/web.pcap port 443
ls -lh /tmp/web.pcap
tcpdump -nn -r /tmp/web.pcap | head -n 30
A small snapshot length records headers without most payload, which also reduces privacy risk.
4. Read it and act
Count who connects, look for repeated resets or retransmissions and compare with web server logs. For rate abuse see the Nginx rate limiting guide and the Fail2ban guide:
# Show who connects and how many times (from a saved capture)
tcpdump -nn -r /tmp/web.pcap 'tcp[tcpflags] & tcp-syn != 0' | awk '{print $3}' | cut -d. -f1-4 | sort | uniq -c | sort -rn | head
For HTTP details, curl is often easier than packets; use the capture when you need to know what the network really did.
5. Mistakes to avoid
These habits cause trouble:
tcpdump with no filter on a busy server    # floods the terminal and the disk
Capture without -c, -s or timeout          # file grows until the disk is full
Sharing a .pcap that contains cookies      # contains private data
Forgetting -nn                             # slow DNS lookups distort the output
Delete captures when you are done and never post them publicly.
6. Illustrative example, not a measurement
Imagine an API (made-up) that sometimes times out. A 60-second capture on port 443 shows many connection attempts from one address but no replies after the SYN. That points to a full backlog or a firewall rule rather than a slow application, so the admin checks the connection limits and rules before changing application code.
7. Common mistakes
- Capturing without any filter.
- No packet count, size or time limit.
- Skipping -nn and waiting on DNS.
- Keeping or sharing pcaps with private data.
- Capturing without permission.
- Reading conclusions into one short capture.
8. Frequently asked questions
Do I need root? Usually yes, or a specific capture capability.
Can tcpdump read HTTPS content? No. It shows encrypted packets and metadata, not the decrypted pages.
Is Wireshark better? It is easier to explore; tcpdump is available on almost every server.
How long should I capture? As little as possible, often 30 to 60 seconds.
9. Quick checklist
- Find the interface.
- Write a narrow filter.
- Use -nn.
- Limit packets and time.
- Save with -w if needed.
- Analyze offline.
- Delete the capture.
If you need help reviewing performance or maintaining a server, see the server management services.
More server and WordPress guides are collected in the article archive.
Official references
tcpdump man page · pcap-filter syntax · Wireshark documentation · ip-link(8)