
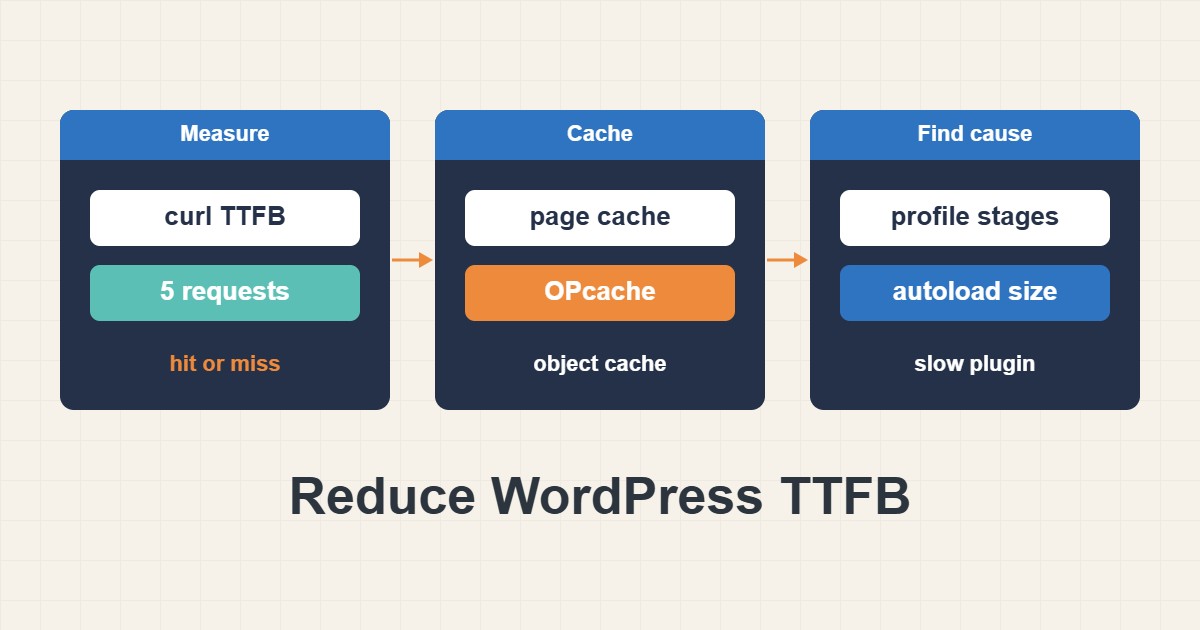
When a WordPress page feels slow, the first number to look at is time to first byte (TTFB): how long the server takes before it starts to send the page. A high TTFB means the work happens on the server, in PHP, the database or a slow plugin, and no amount of image compression will fix that. The fix is usually a short list of boring things: a page cache, enough PHP memory and workers, a database that is not loading too much data, and one or two plugins that need to be replaced. This guide shows how to measure TTFB properly, find where the time goes and fix the most common causes in a sensible order. Commands assume shell access; on shared hosting the same ideas apply through the control panel and plugins.
1. Measure TTFB the right way
A browser number mixes network, rendering and server time. Use curl to separate the phases:
# Break one request into phases (seconds)
curl -o /dev/null -s -w 'dns:%{time_namelookup} connect:%{time_connect} tls:%{time_appconnect} ttfb:%{time_starttransfer} total:%{time_total}\n' https://example.com/
These values are cumulative: each is measured from the start of the request, so the duration of a phase is the difference between consecutive values (TLS takes roughly tls − connect, and waiting for the server roughly ttfb − tls). If the connect and TLS differences are small and the wait is large, the server is likely slow to build the page, although distance, a CDN or proxy, and a WAF can contribute and should be checked separately. If the connect or TLS difference is large, look at the network and the TLS setup. As a rough guide, a cached page should answer in well under a few hundred milliseconds from a nearby location, while an uncached dynamic page often takes longer. Treat any numbers as relative to your own baseline rather than universal targets.
2. Compare cached and uncached requests
A single request tells you little, because the first one may be a cache miss. Repeat the request and look at the headers:
# Repeat 5 times; the first request may be a cache miss
for i in 1 2 3 4 5; do
  curl -o /dev/null -s -w '%{http_code} ttfb=%{time_starttransfer}\n' https://example.com/
done
curl -sI https://example.com/ | grep -i -E 'cache|age|x-'
If the first request is slow and the next four are fast, a cache works and the slow part is the miss. If all five are slow, a page cache may be inactive or bypassing this request (check the headers), but an active cache can also respond slowly, for example because of early expiry, a slow cache layer or the network, so read the headers rather than relying on timings alone. Also test a logged-in request or a URL with a query string, because many caches bypass those on purpose; a slow admin area with a fast front end is normal and is a different problem.
3. Turn on a page cache first
For most sites the single biggest win is serving a stored HTML page instead of running PHP. A caching plugin, a server-level cache or a CDN edge cache can do it. Exclude pages that must stay dynamic: the cart, checkout, account pages and anything that depends on a cookie. Check that the cache respects logged-in users and does not store private pages. After enabling it, repeat step 2 and confirm that the header or the timings show a hit.
4. Find the slow part with a profiler
If uncached requests are slow, find out which stage costs the time. The WP-CLI profile package breaks a request into stages and hooks:
# WP-CLI profile package: where does the time go?
wp package install wp-cli/profile-command
wp profile stage --fields=stage,time,query_count
wp profile hook template_redirect --fields=callback,time,query_count
The output shows how much time goes to bootstrapping, loading themes and plugins and rendering the template, and which callbacks run the most queries. The Query Monitor plugin gives a similar view inside the admin bar, including slow queries and the plugin responsible for them. Use these on a staging copy or at quiet times, because profiling itself adds load.
5. Check how much data loads on every request
WordPress loads all autoloaded options on every request. When plugins leave large values behind, every page pays for them:
-- How much data loads on every request?
SELECT ROUND(SUM(LENGTH(option_value))/1024) AS autoload_kb
FROM wp_options
WHERE autoload IN ('yes','on','auto','auto-on');
A few hundred kilobytes is common. Several megabytes is a problem worth fixing. Optimize WordPress wp_options Autoload Data explains how to find the largest entries and clean them safely. Always take a database backup first and change one thing at a time.
6. Keep PHP code in memory with OPcache
Without OPcache, PHP compiles every file again on every request. Most hosts enable it, but the defaults can be too small for a WordPress site with many plugins. Check the settings and the hit rate:
; php.ini / pool settings: keep compiled PHP in memory
opcache.enable=1
opcache.memory_consumption=192
opcache.max_accelerated_files=20000
opcache.validate_timestamps=1
opcache.revalidate_freq=60
If the cache fills up, you will see frequent restarts and the site slows down under load. After changing the settings, reload PHP. If a deployment seems to keep old code, Fix Stale PHP Code After Deployment with OPcache explains the revalidation settings that cause it.
7. Size PHP workers and memory sensibly
If many requests arrive at once and every worker is busy, the extra requests wait in a queue, and TTFB rises even though each page is fast. Too few workers causes queueing, while too many exhausts memory and makes the server swap. Tune PHP-FPM and Fix 504 Gateway Timeout: A Practical Pool Guide shows how to size a pool from real memory per worker and how to read the slow log. On shared hosting you cannot change this, so ask the host about worker limits if the problem appears only under load.
8. Add an object cache when the database is the bottleneck
A persistent object cache such as Redis stores query results between requests. It helps dynamic sites with many repeated queries, such as stores and membership sites. It does little for a static blog that already uses a page cache. If you add it, test that sites sharing a server do not share keys, and that changes appear when content is updated. WordPress Redis Object Cache: Isolation and Invalidation Tests describes isolation and invalidation tests for exactly this.
9. Replace the heavy plugin, not the whole stack
Profiling often points to one plugin, such as a related-posts query, a visual builder or an analytics tool that calls a remote service on every page load. Replace or disable that one thing and measure again. Remote calls are a classic cause: if a plugin waits on a third-party API during page generation, your TTFB includes that API’s response time. Cache the result or move the call to a background job.
10. Check the basics at the hosting level
- Use a supported PHP version; newer versions are usually faster.
- Make sure the database server is local or on a fast private network.
- Check that the server is not out of CPU, memory or disk I/O during slow periods.
- Look at cron: heavy scheduled jobs running during traffic can slow pages.
- Enable compression and HTTP/2 or HTTP/3 on the web server or CDN.
11. A worked example
A blog shows a TTFB of over a second on every page. Five repeated requests are all slow, so no page cache is serving them. The owner enables a page cache, and the next four requests are fast. A profiler also shows a plugin running many queries, and the autoload query reports a large total. Removing the plugin and cleaning the leftovers cuts the uncached time as well. This is an illustration of the order of work, not a measurement from a real site.
12. Common mistakes
- Compressing images to fix a slow server response.
- Installing several cache plugins that fight each other.
- Caching pages that depend on a cookie, such as carts.
- Judging speed from one request or from a logged-in session.
- Raising PHP memory without checking what uses it.
- Changing many settings at once so nothing can be attributed.
13. Quick checklist
- Measure TTFB with curl, repeated several times.
- Confirm whether a page cache is serving the request.
- Enable and tune a page cache with sensible exclusions.
- Profile uncached requests to find the slow stage or plugin.
- Check autoload size and clean leftovers.
- Verify OPcache size and the PHP worker pool.
- Add an object cache only if the database is the bottleneck.
- Re-measure after every change and keep notes.
If you need help reviewing performance or maintaining a server, see the server management services.
More server and WordPress guides are collected in the article archive.
Official references
WordPress: Optimization · Query Monitor plugin · PHP: OPcache configuration · WP-CLI: profile-command