
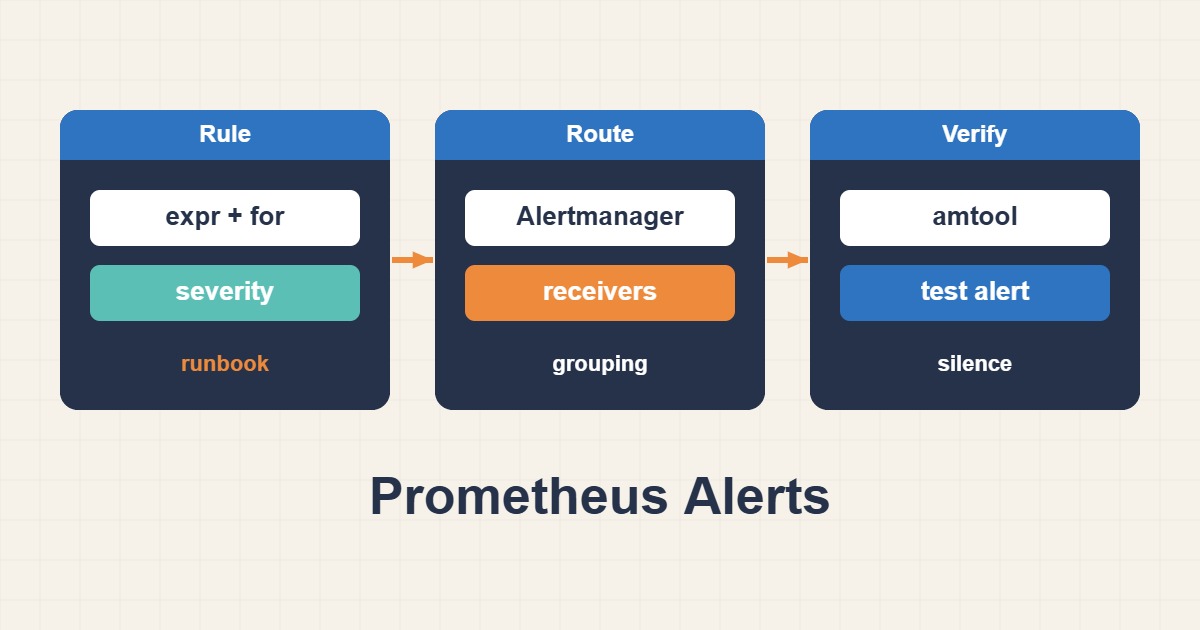
A loaded rule alone is insufficient: scrape health, pending/firing states, Alertmanager and the receiver all need testing. Build two baseline alerts for exporter reachability and filesystem headroom with durations and runbooks.
Scope and prerequisites
The example assumes Prometheus, node_exporter with job=node and configured Alertmanager. Read job names and labels from actual metrics. mountpoint=/ assumes the exporter sees the host root filesystem. Replace example runbook URLs before activation and do not trust an untested notification receiver.
1. Collect evidence
Inspect scrape errors and the latest successful target scrape. up == 0 means a scrape failed, not necessarily that the website is down. A target removed from discovery can lose its metric entirely and evade this rule. Expected-target coverage and synthetic HTTP availability need separate checks.
# Query these in the Prometheus expression browser:
up{job="node"}
node_filesystem_avail_bytes{job="node",mountpoint="/"}
node_filesystem_size_bytes{job="node",mountpoint="/"}
2. Make a controlled change
for filters brief spikes by requiring the condition to remain active across evaluations. Keep routing labels such as severity and team stable; put changing measurements and timestamps in annotations so fingerprints do not churn. Grouping, silencing and inhibition belong to Alertmanager, not the rule file alone.
groups:
- name: host-baseline
  rules:
  - alert: NodeScrapeUnavailable
    expr: up{job="node"} == 0
    for: 5m
    labels:
      severity: page
      team: infrastructure
    annotations:
      summary: "Exporter unreachable on {{ $labels.instance }}"
      runbook_url: "https://ops.example.test/runbooks/node-down"
  - alert: RootFilesystemLowSpace
    expr: (node_filesystem_avail_bytes{job="node",mountpoint="/",fstype!~"tmpfs|overlay"} / node_filesystem_size_bytes{job="node",mountpoint="/",fstype!~"tmpfs|overlay"}) < 0.10
    for: 10m
    labels:
      severity: warning
      team: infrastructure
    annotations:
      summary: "Root filesystem below 10% free on {{ $labels.instance }}"
      runbook_url: "https://ops.example.test/runbooks/disk-space"
3. Verify the outcome
Validate syntax with promtool and maintain rule tests in CI. In staging, induce a short failure and a sustained one: only the latter should page. Verify recovery and the resolved notification too. A firing rule without successful receiver delivery is not an operationally successful alert.
promtool check rules /etc/prometheus/rules/host-baseline.yml
promtool check config /etc/prometheus/prometheus.yml
# Use your deployment's supported reload after all checks pass.
# Confirm Pending -> Firing -> Resolved and actual receiver delivery.
Rollback and prevention
Rollback the changed rule and use the supported reload path; permanent silences are not repairs. Calibrate thresholds against capacity, growth and on-call coverage. Never expose receiver tokens in published files or logs. The monitoring system itself needs an independently tested failure-notification path.
Technical references
For related checks in this workflow, see Persistent journald Logs and Safe Retention on Linux and Docker Healthchecks: Running Is Not the Same as Healthy.