
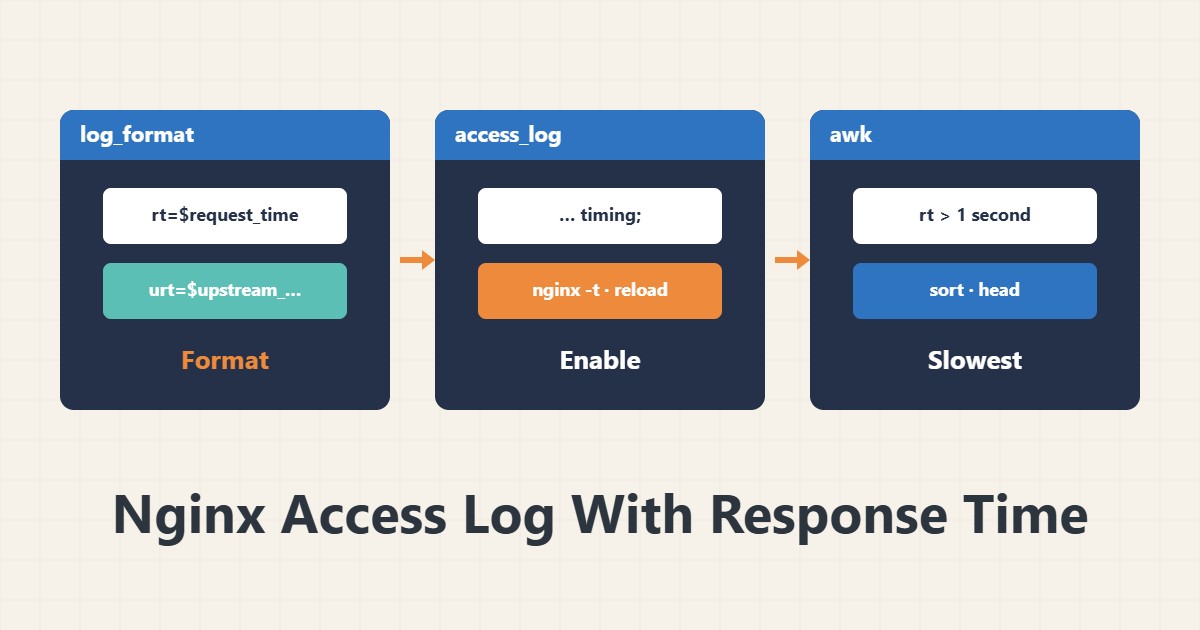
The default Nginx log says who asked for what, but not how long the answer took. Two extra variables let you find the slowest requests without extra tools and tell whether the delay comes from Nginx or from the application.
1. A log format with timings
Define a new format in the http block:
log_format timing '$remote_addr - $remote_user [$time_local] "$request" '
                  '$status $body_bytes_sent "$http_referer" "$http_user_agent" '
                  'rt=$request_time urt=$upstream_response_time';
$request_time is the total time from reading the request to sending the response, and $upstream_response_time is how long the application behind Nginx (for example PHP-FPM) took.
2. Enable it
access_log /var/log/nginx/access.log timing;Then run sudo nginx -t and reload. From now on each line carries the timings. With several sites you can give each its own log.
3. The slowest paths
awk '{for(i=1;i<=NF;i++) if($i ~ /^rt=/){split($i,a,"="); if(a[2]>1) print a[2], $7}}' /var/log/nginx/access.log | sort -rn | head -20This lists requests slower than one second together with their path. Field $7 is the request path for the format above; change it if you change the format.
4. Where does the delay come from?
If rt and urt are nearly equal, the time is spent in the application; look at the MySQL slow query log. If rt is much larger than urt, the cause may be a slow client download or a large response. Review proxy settings in Nginx as a reverse proxy.
5. Size and privacy
The access log stores visitor IPs, so keep retention short and defined, and set up log rotation properly so the disk does not fill.
6. Illustrative example, not a measurement
Suppose several lines show rt=4.2 and urt=4.1 for one fixed path. That means nearly all the time went to the application, and Nginx is not to blame. These numbers are invented for explanation, not a real measurement.
7. Common mistakes
- Changing the format without nginx -t and a reload.
- Analysing with an old field number after changing the format.
- Keeping logs with no time limit.
- Drawing conclusions from one slow request instead of a repeating pattern.
8. Frequently asked questions
How does $request_time differ from $upstream_response_time? The first is the whole request time, the second only the backend response time.
What if urt is a dash? The request did not go to an upstream, for example a static file.
Does the log grow a lot? A little more; log rotation keeps that in check.
9. Quick checklist
- log_format timing defined.
- access_log pointed at the new format.
- nginx -t and reload done.
- Slowest paths listed with awk.
- Log rotation and retention are defined.
If you need help reviewing performance or maintaining a server, see the server management services.
More server and WordPress guides are collected in the article archive.
Official references
Nginx ngx_http_log_module · Nginx variable $request_time · Nginx variable $upstream_response_time