
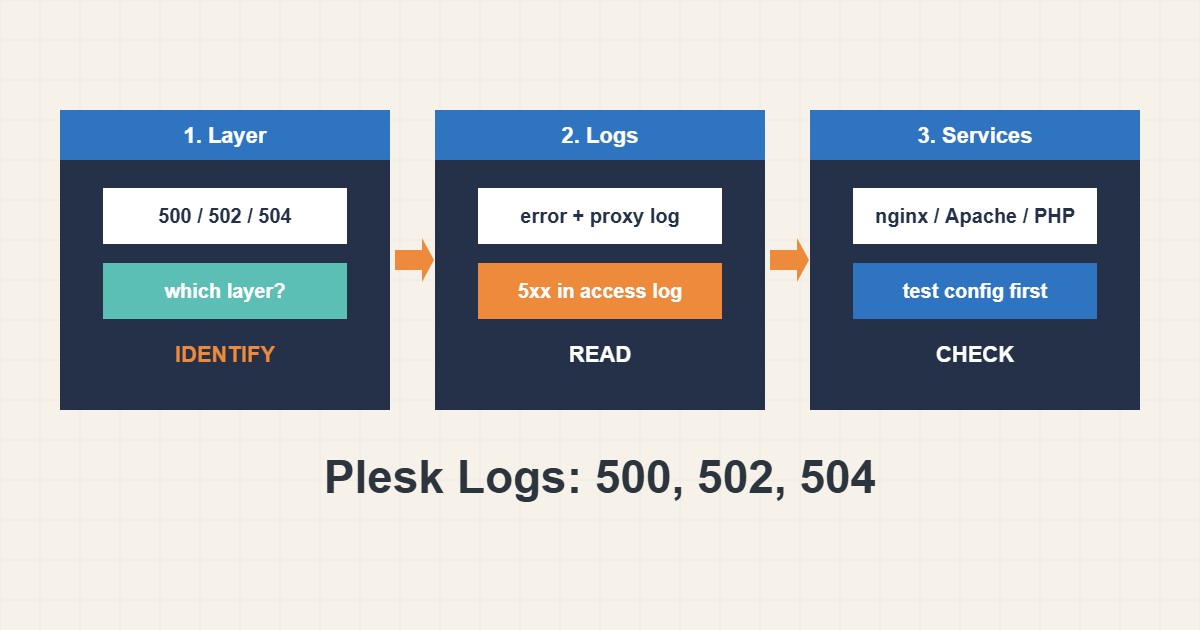
When a site on Plesk shows 500, 502 or 504, the browser gives no reason. Plesk usually runs nginx in front of Apache or PHP-FPM, so the error can come from several layers, and each layer writes its own log. This guide shows where to find the logs of a domain, how to tell which layer failed from the status code, and a short order of checks that finds the cause without random restarts. Paths and menu names differ with the Plesk version, the operating system and the settings of your provider, so treat the examples as a starting point.
1. Understand the layers
A typical Plesk request goes browser, then nginx, then Apache or PHP-FPM, then PHP code and the database. A 500 usually means the application or an Apache rule failed. A 502 means nginx got no valid answer from the layer behind it. A 504 means that layer took too long. Knowing this tells you which log to open first and avoids wasting time on the wrong one.
2. Open the logs of the domain
In Plesk open Websites & Domains, the domain and then Logs. You will see the access log, the error log and, when nginx is used as a proxy, its own logs. Administrators can also use the Log Browser under Tools & Settings. In Terminal the same files are usually here:
# Logs of one domain (replace example.com)
cd /var/www/vhosts/system/example.com/logs
ls -lh
tail -n 40 error_log
tail -n 40 proxy_error_log
Reproduce the error, then read the newest lines with the matching time, not the oldest. The error log shows the reason and the access log shows the status code and the URL.
3. Find the failing requests
The access log shows which URLs return 5xx and how often. A read-only filter:
# Last 5xx responses in the access log (Common/Combined log format)
awk '$9 ~ /^5/ {print $4, $7, $9}' access_log | tail -n 20
The pattern matters: if one URL fails, the cause is likely in that page or plugin; if everything fails, look at services and resources. If the failing time matches a spike in traffic or a cron job, suspect resource limits. Compare with the guides on resource limit errors and slow responses and TTFB.
4. Check that the services run
If logs show connection refused or no live upstream, the service behind nginx may be stopped or crashed. Look at its status and test the configuration:
systemctl status nginx --no-pager | head -n 8
systemctl status apache2 --no-pager | head -n 8   # on RHEL-like systems: httpd
nginx -t
plesk bin php_handler --list
The last command lists PHP handlers. Do not restart everything at once on a production server; restart the one service that looks wrong, and read its log again. A configuration test before a reload prevents turning a small problem into an outage.
5. Match the message to the usual fix
A PHP fatal error in the error log points to a plugin, theme or PHP version mismatch; see the PHP version guide. “Invalid command” or “syntax error” near .htaccess means a bad rule; rename the file and retest. “Primary script unknown” or “Permission denied” points to the document root or permissions. Timeouts on slow requests suggest raising the time limit only after you know why the request is slow, and a very low PHP-FPM worker count can queue requests until they time out.
6. Keep a short record
Write down the time, the URL, the status code, the log line and the one change you made. If the problem returns, you will see the pattern. Make one change at a time, and undo a change that did not help. If you cannot find the cause, send your provider the exact time, URL and the error line, with passwords and personal data removed.
7. Illustrative example, not a measurement
Imagine a site that shows 502 for a few minutes every hour (a made-up pattern). The proxy error log says there is no live upstream at those times, and a scheduled backup starts at the same minute. The backup uses so much memory that the PHP handler is killed and restarted. Moving the backup to a quiet time or limiting its load removes the 502, without any change to WordPress.
8. Common mistakes
- Restarting every service without reading a log.
- Reading an old log line from a different problem.
- Raising timeouts before knowing why the request is slow.
- Deleting .htaccess instead of renaming it.
- Changing many settings at once.
- Sharing logs with credentials or personal data in them.
9. Frequently asked questions
Which log should I read first? Start with the error log of the domain at the time of the failure, then the proxy error log if the status is 502 or 504.
Why does Plesk have two sets of logs? Because nginx and Apache or PHP-FPM are separate layers. Each writes what it saw.
Are 502 and 504 the same? No. 502 means a bad or missing answer from the layer behind; 504 means that layer was too slow.
Can I change the log retention? Plesk has log rotation settings, and your provider may manage them. Do not delete live logs by hand.
10. Quick checklist
- Reproduce the error and note the time and URL.
- Decide which layer matches the status code.
- Open the domain error log and the proxy error log.
- Filter the access log for 5xx lines.
- Check services and test the configuration.
- Match the message to the usual cause.
- Change one thing at a time and record it.
If you need help reviewing performance or maintaining a server, see the server management services.
More server and WordPress guides are collected in the article archive.
Official references
Plesk Obsidian: Website Logs · Plesk Obsidian: Log Browser · nginx: ngx_http_proxy_module · Apache HTTP Server: Log files