
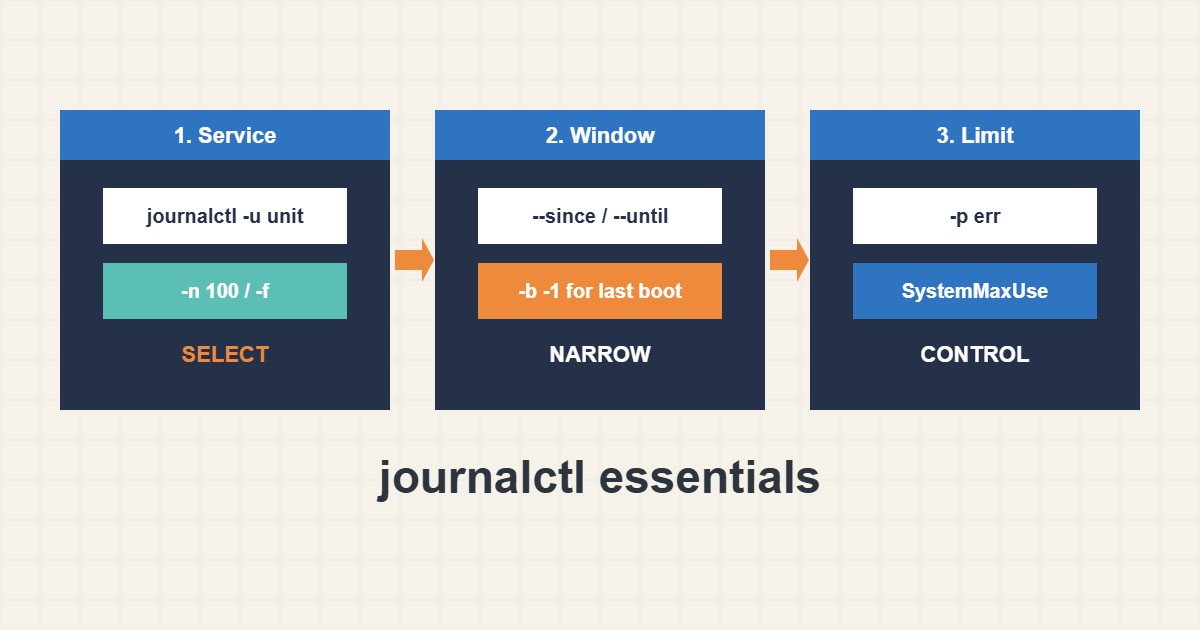
On a modern Linux server many services write to the systemd journal instead of plain log files. journalctl can answer most “what happened?” questions, but only if you filter. This guide shows the handful of options that cover daily troubleshooting: by service, by time, by priority and by boot, plus how to keep the journal from growing forever. Commands follow the systemd documentation; I did not run them on your server, and some systems store the journal only in memory.
1. Read one service
Use -u to select a unit, -n for the last lines and -f to follow live. Add --no-pager when you want to pipe the output:
journalctl -u nginx --since "1 hour ago" --no-pager
journalctl -u myapp -n 100 --no-pager
journalctl -u myapp -f                  # follow live
journalctl -p err -b --no-pager         # errors since this boot
This is the quickest way to see why a service you wrote in the systemd service guide failed to start.
2. Filter by time and boot
Always narrow the time window to the incident. You can also look at a previous boot, which is useful after a crash or unexpected reboot:
journalctl --since "2026-10-27 09:00" --until "2026-10-27 09:30" --no-pager
journalctl -b -1 -p warning --no-pager  # previous boot, warnings and worse
journalctl --list-boots
If --list-boots shows only one boot, the journal is probably not persistent and older data is gone after each restart.
3. Filter by priority and text
Priority levels run from emerg to debug. -p err shows errors and worse; -p warning adds warnings. For text search use -g with a pattern, and combine it with a unit and a time window so the result stays readable.
4. Control disk usage
A journal that grows without limits can fill the disk. Check its size, remove old entries by age or size, and set a permanent limit:
journalctl --disk-usage
sudo journalctl --vacuum-time=14d
sudo journalctl --vacuum-size=500M

# /etc/systemd/journald.conf.d/size.conf
[Journal]
SystemMaxUse=500M
Storage=persistent
Persistent storage keeps logs across reboots, which is valuable for troubleshooting; just pair it with a size limit. Plain file logs still need rotation, as in the logrotate guide.
5. Habits to avoid
These habits waste time or destroy evidence:
journalctl                       # dumps everything in a pager: slow and noisy
journalctl | grep error         # misses lines and loses context
sudo rm -rf /var/log/journal/*  # deletes history instead of limiting it
Prefer the built-in filters over grep on the whole output, and use the vacuum options rather than deleting files by hand.
6. Illustrative example, not a measurement
Imagine a web app (made-up) that restarts at night. journalctl -u myapp for the hour around the restart shows an out-of-memory kill message just before it. Looking at the previous boot confirms the same pattern on another night. The fix is then a memory limit review rather than guessing in the app code.
7. Common mistakes
- Reading the whole journal without filters.
- Forgetting the time window.
- Expecting old logs when storage is not persistent.
- Letting the journal grow without a limit.
- Deleting journal files by hand.
- Using grep when -g or -p would do.
8. Frequently asked questions
How do I see logs from before the last reboot? Use journalctl -b -1, if the journal is persistent.
How do I make the journal persistent? Set Storage=persistent in a journald.conf drop-in and restart journald.
How do I limit its size? Use SystemMaxUse in journald.conf or the vacuum commands.
Can I export logs for a support ticket? Yes, redirect a filtered, time-limited output to a file.
9. Quick checklist
- Select the unit with -u.
- Set a time window.
- Use -p to cut noise.
- Check previous boots if needed.
- Check journalctl –disk-usage.
- Set SystemMaxUse.
- Save the filtered output for notes.
If you need help reviewing performance or maintaining a server, see the server management services.
More server and WordPress guides are collected in the article archive.
Official references
journalctl manual · journald.conf manual · Journal fields reference · Arch Wiki: systemd/Journal