
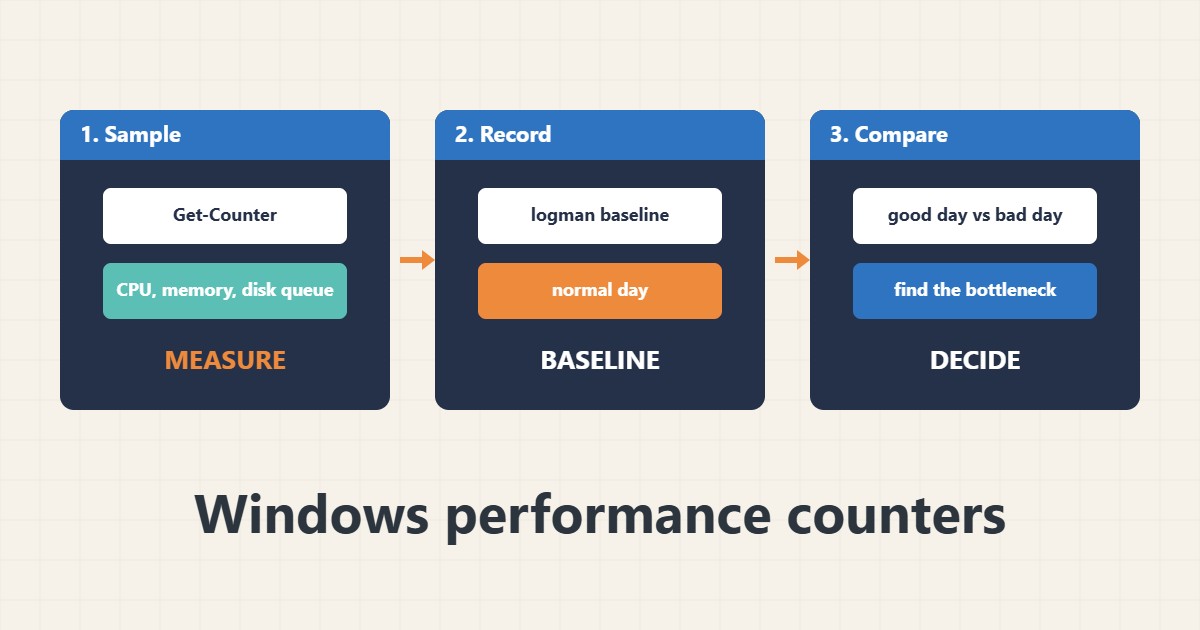
When a Windows server feels slow, Task Manager shows only the present moment. Performance counters give numbers you can sample, record and compare. The key habit is a baseline: counters from a normal day that you can compare to a bad day. This guide shows a short check with PowerShell and a recorded baseline with logman. Commands follow the Microsoft documentation; I did not run them on your server, and counter names depend on the Windows language and installed roles.
1. Take a quick snapshot
Sample CPU, available memory and disk queue several times, not just once:
Get-Counter '\Processor(_Total)\% Processor Time','\Memory\Available MBytes','\PhysicalDisk(_Total)\Avg. Disk Queue Length' -SampleInterval 5 -MaxSamples 6Sustained high values matter more than a single spike.
2. Find the busy processes
Check which processes use CPU and memory, and compare with the counter view:
Get-Process | Sort-Object CPU -Descending | Select-Object -First 8 Name, Id, CPU, WS
Get-Counter '\Process(*)\% Processor Time' |
  Select-Object -ExpandProperty CounterSamples | Sort-Object CookedValue -Descending | Select-Object -First 8 InstanceName, CookedValue
For IIS-related errors see the IIS 500 troubleshooting guide in the archive and read the restart timeline in the event log guide.
3. Record a baseline
Create a counter log during a normal period, then keep it as a reference:
logman create counter WebBaseline -c "\Processor(_Total)\% Processor Time" "\Memory\Available MBytes" "\LogicalDisk(C:)\Avg. Disk sec/Transfer" -si 00:00:30 -o C:\PerfLogs\WebBaseline
logman start WebBaseline
# later: logman stop WebBaseline
Store logs on a disk with free space; see the backup guide for keeping copies. Use a scheduled job to start and stop it; see the Task Scheduler guide in the archive.
4. Read the result
Convert the log to CSV and open it in a spreadsheet or compare averages between a good and a bad day:
Import-Csv C:\PerfLogs\WebBaseline.csv | Select-Object -First 5
relog C:\PerfLogs\WebBaseline_000001.blg -f CSV -o C:\PerfLogs\WebBaseline.csv
A high disk queue with low CPU points to storage; high CPU in one process points to that application.
5. Mistakes to avoid
These habits give misleading conclusions:
Judging by one 5-second sample        # spikes mislead; look at trends
Using Task Manager only                # no history, no record
No baseline from a healthy day         # nothing to compare with
Looking at CPU while the disk queue is high   # the real bottleneck is storage
Document what changed between the baseline and the slow period.
6. Illustrative example, not a measurement
Imagine a file server (made-up) that is slow every morning. The baseline shows low CPU and memory but a disk queue far above normal at 9:00, when a backup overlaps with user logins. Moving the backup earlier removes the queue without adding hardware.
7. Common mistakes
- Judging from one sample.
- Using only Task Manager.
- Having no baseline.
- Watching CPU only.
- Not recording what changed.
- Leaving counter logs running forever.
8. Frequently asked questions
What is a baseline? Counter data from a normal period used for comparison.
Why is the disk queue useful? It shows if storage cannot keep up with requests.
Are counter names the same everywhere? Not always; they depend on the language and roles.
Does logging slow the server? A modest interval has little effect.
9. Quick checklist
- Sample counters several times.
- Find the busy process.
- Record a baseline.
- Compare good and bad days.
- Look at disk, memory and CPU.
- Note changes.
- Stop old counter logs.
If you need help reviewing performance or maintaining a server, see the server management services.
More server and WordPress guides are collected in the article archive.
Official references
Microsoft: Get-Counter · Microsoft: logman · Microsoft: typeperf · Microsoft: Get-Process