
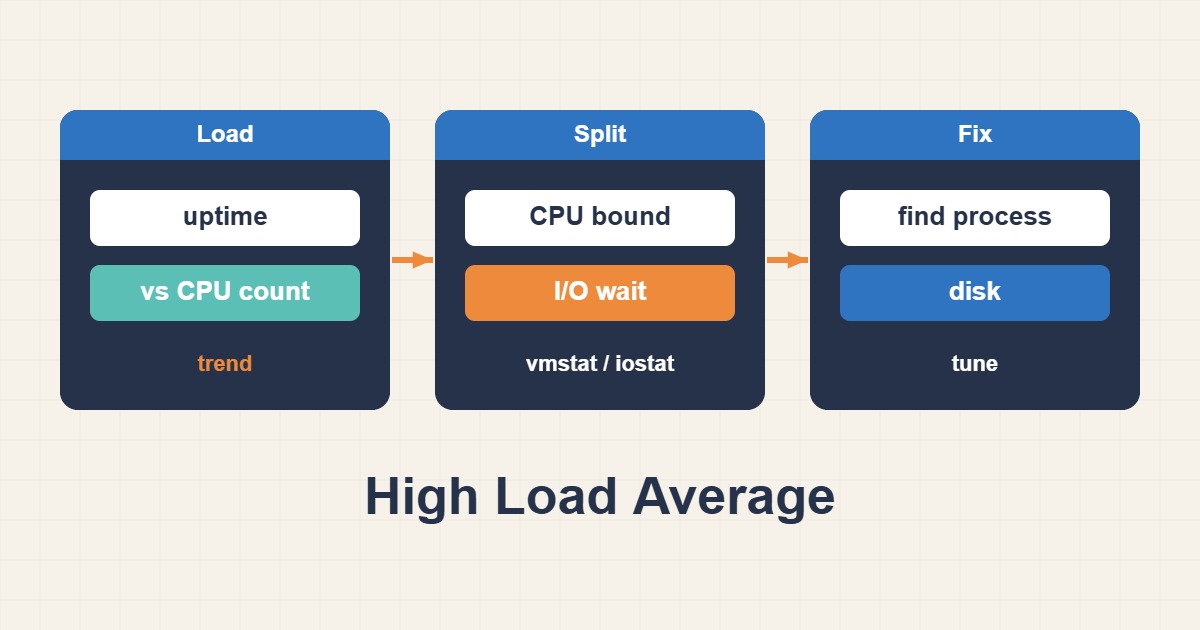
A high load average does not automatically mean the CPU is exhausted. Linux counts both runnable tasks and tasks stuck in uninterruptible I/O sleep. That is why a server can report a high load while the CPUs still appear partly idle. The useful question is not “How do I lower the number?” but “Which resource is making work wait?”
Read load in context
uptime reports one-, five-, and fifteen-minute averages. Compare them with the number of logical CPUs and with application latency. A one-minute spike with a much lower fifteen-minute value is different from a sustained rise across all three windows.
nproc
uptime
cat /proc/loadavg
Separate CPU pressure from blocked I/O
Run vmstat 1 and watch r, b, and wa together. A long runnable queue with busy CPUs points toward CPU contention. Blocked tasks and rising I/O wait while CPU idle remains available usually point toward storage, swapping, or a slow network filesystem.
vmstat 1
mpstat -P ALL 1
pidstat -u -d 1
Find the slow device and the process behind it
Sample iostat -xz 1 several times. Look at latency, queue depth, throughput, and device saturation rather than relying on one field. Backups, log compression, database checkpoints, swap, and noisy shared storage are common causes. In a virtual machine, high steal time can also expose contention on the host.
iostat -xz 1
iotop -oPa
lsblk -o NAME,FSTYPE,SIZE,MOUNTPOINTS
Use PSI to measure workload stalls
Modern kernels expose CPU, memory, and I/O Pressure Stall Information under /proc/pressure. The values describe how much time work lost because a resource was unavailable. For memory and I/O, a rising full value is especially serious because every non-idle task was stalled at the same time.
for f in /proc/pressure/{cpu,memory,io}; do echo ===$f; cat $f; donePreserve evidence before restarting
A restart may restore service but erase the best clues. Record the PID, command, start time, open files, and correlation with cron, backups, deploys, or traffic peaks. The durable fix may be query tuning, concurrency control, moving a batch job, increasing storage IOPS, or correcting log retention.
Quick checklist
- Compare load with CPU count and the 1/5/15-minute trend.
- Use vmstat to distinguish runnable from blocked work.
- Use iostat and pidstat to identify the device and process.
- Check memory pressure, swap, steal time, and PSI.
- Capture evidence before killing a process or restarting a service.
Frequently asked questions
Is a high load average always an incident?
No. Judge it against CPU count, service latency, and workload. A short backup spike may be acceptable; sustained load with rising response times is not.
Does 100% device utilization prove the disk is failing?
No. Device architecture matters. Confirm the diagnosis with latency, queue depth, throughput, errors, and provider limits.
What is the best first command?
Start with uptime, vmstat 1, and iostat -xz 1 side by side, then use pidstat or iotop to identify the responsible process.
Related guides
Technical references: Linux Kernel PSI and I/O statistics documentation, plus proc_loadavg(5).