
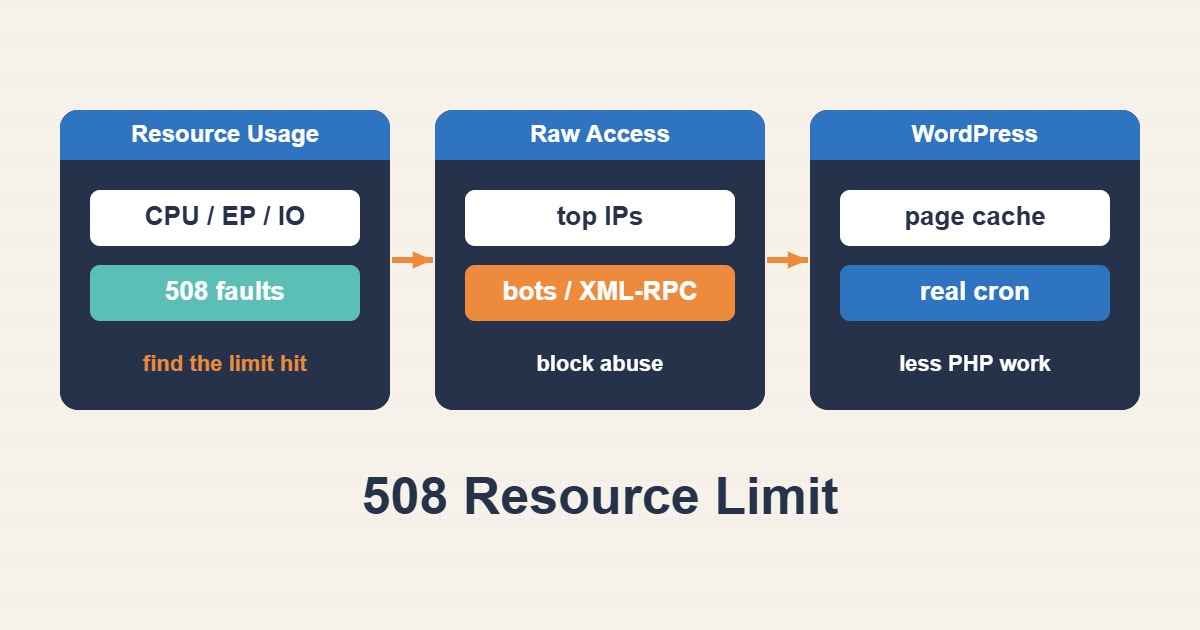
“508 Resource Limit Is Reached” means your hosting account tried to use more of the server than its plan allows, and the server refused new requests for a while. On many shared hosts the limits come from CloudLinux, which gives every account a fixed slice of CPU, memory, processes and disk activity. The error often comes in bursts during traffic spikes, bot attacks or heavy WordPress tasks. This guide explains how to read the limits, find what is eating them and reduce usage so the error stops, before you decide whether you need a bigger plan.
1. What the error actually says
The page is not an application error. Your site did not crash, and PHP is not broken. The server isolates each account, and when the account reaches one of its caps, extra requests are rejected, usually with a 508 status or a short “resource limit” page. Because it depends on load at that moment, the site may work for most visitors and fail for others, which makes it look random. Wording differs by provider, so check what your host calls these limits.
2. Open Resource Usage in cPanel
In cPanel, look for Resource Usage under Metrics. It shows graphs and a table with the limit, the current usage and the number of faults for each resource over the chosen period. A fault is a moment when the limit stopped something. The resource with faults is your clue, and the time of the faults tells you when to look in the logs.
3. Know the typical limits
Names vary, but the common ones are these. CPU is processor time, often shown as a percentage of a core. Memory is physical memory the account can use. Entry processes is the number of simultaneous connections into PHP, so slow pages that overlap quickly fill it. Number of processes counts all running processes of the account. I/O and IOPS limit disk throughput and operations. Hitting entry processes usually means many requests arriving while PHP is slow, and hitting CPU usually means expensive PHP or database work.
4. Find out who is asking
Download or open the raw access log for the faulting period from cPanel’s Raw Access, or read it by SSH if allowed. Look at the top clients, URLs and user agents:
awk '{print $1}' access.log | sort | uniq -c | sort -rn | head -20
awk '{print $7}' access.log | cut -d'?' -f1 | sort | uniq -c | sort -rn | head -20
The first command lists the most active IP addresses, the second the most requested paths. A flood of requests to wp-login.php, xmlrpc.php or random URLs points to an attack or a bad crawler. Many requests to admin-ajax.php point to a plugin or page that polls constantly. Check who is making the requests:
awk -F'"' '{print $6}' access.log | sort | uniq -c | sort -rn | head -15Aggressive crawlers and scanners often identify themselves, but they can also pretend to be browsers, so judge by behavior as well as name.
5. Stop abusive requests early
Blocking noise before it reaches PHP is the cheapest improvement. If you do not use XML-RPC, you can deny access to that file:
Require all denied
Protect the login page with a limit on attempts, a security plugin or a firewall that your host offers, and consider a CDN with rate limiting in front of the site. Block clearly abusive IP ranges in the cPanel IP Blocker. Only block what you have confirmed in the logs, because an aggressive rule can lock out real visitors or search engines.
6. Add page caching
An uncached WordPress page runs PHP and several database queries on every visit. A page cache stores the finished HTML so repeat visitors do not touch PHP at all. This one change often cuts CPU and entry processes sharply on a content site. Use a well-known caching plugin or your host’s built-in cache, and exclude pages that must stay dynamic, such as the cart and checkout. See the WordPress optimization guide in the references for options.
7. Move WP-Cron off page loads
By default WordPress checks scheduled tasks on visits, and a busy or slow task can pile up. List what is scheduled, and consider a real system cron instead of visit-triggered cron:
wp cron event list --fields=hook,next_run_relative --format=table
wp plugin list --status=active --fields=name,version
Then disable the built-in trigger and run it from cPanel Cron Jobs every few minutes:
define( 'DISABLE_WP_CRON', true );*/15 * * * * /usr/local/bin/php -q $HOME/public_html/wp-cron.php >/dev/null 2>&1The full method, including checks, is in Fix WP-Cron with a Real System Cron Job. Adjust the PHP path to what your host uses.
8. Cut plugin and database cost
Deactivate plugins you do not use, replace heavy ones and watch for plugins that run scans or backups during the day. A bloated options table makes every request slower, and Optimize WordPress wp_options Autoload Data shows how to measure it. If database CPU is the problem, read How to Diagnose High MySQL CPU and Slow Queries on a Web Server for finding slow queries.
9. Handle the admin and Heartbeat
The WordPress dashboard sends periodic background requests, and several people editing at once can add load. Limit unnecessary admin sessions during peak hours and keep long-running imports and backups for quiet periods. If the admin area itself triggers faults, check which plugin makes the repeating admin-ajax.php calls.
10. Images, hotlinking and static files
Large images increase I/O and bandwidth, and other websites that embed your images can add traffic you do not benefit from. Compress images when you upload, serve modern formats and let browsers cache static files. A CDN reduces the number of requests your own account must serve.
11. When to talk to your host
If usage stays high after the steps above, contact support with data: the dates and times of the faults, the resource that hit its limit and a few suspicious log lines. Ask what the limits are and whether a higher plan or a different environment fits your traffic. If you constantly run near the limits with legitimate traffic, a bigger plan or a VPS is the honest fix, not more tweaking.
12. Common mistakes
- Treating the error as a WordPress crash and reinstalling plugins.
- Ignoring the Resource Usage page and guessing the cause.
- Blocking IPs without checking the logs first.
- Running heavy backups or imports during peak traffic.
- Leaving page caching off on a content site.
- Upgrading the plan before removing obvious waste.
13. When the traffic is real
A successful campaign or a popular article can legitimately overload a small plan. In that case reduce per-request cost with caching, put a CDN in front, and schedule the campaign with the host’s limits in mind. Sudden growth that stays is a reason to move up, and it is better to do that on your schedule than during an outage.
14. A worked example
A blog gets 508 errors every afternoon. Resource Usage shows faults on entry processes, and the access log shows thousands of requests to xmlrpc.php from a few ranges. The owner denies that file, adds a page cache and moves WP-Cron to a real cron job. The next day Resource Usage shows no faults. This is an illustration of the process, not a measurement from a real site.
15. Quick checklist
- Open Resource Usage and note which limit has faults and when.
- Read the access log for that time window.
- Block confirmed abuse and protect login and XML-RPC.
- Enable page caching and move WP-Cron to a real cron job.
- Remove heavy plugins and fix slow queries.
- Contact the host with data, and upgrade only if usage is legitimate.
More server guides are collected in the article archive.
Official references
cPanel: Resource Usage · cPanel: Raw Access · WordPress: Cron · WordPress: Optimization