
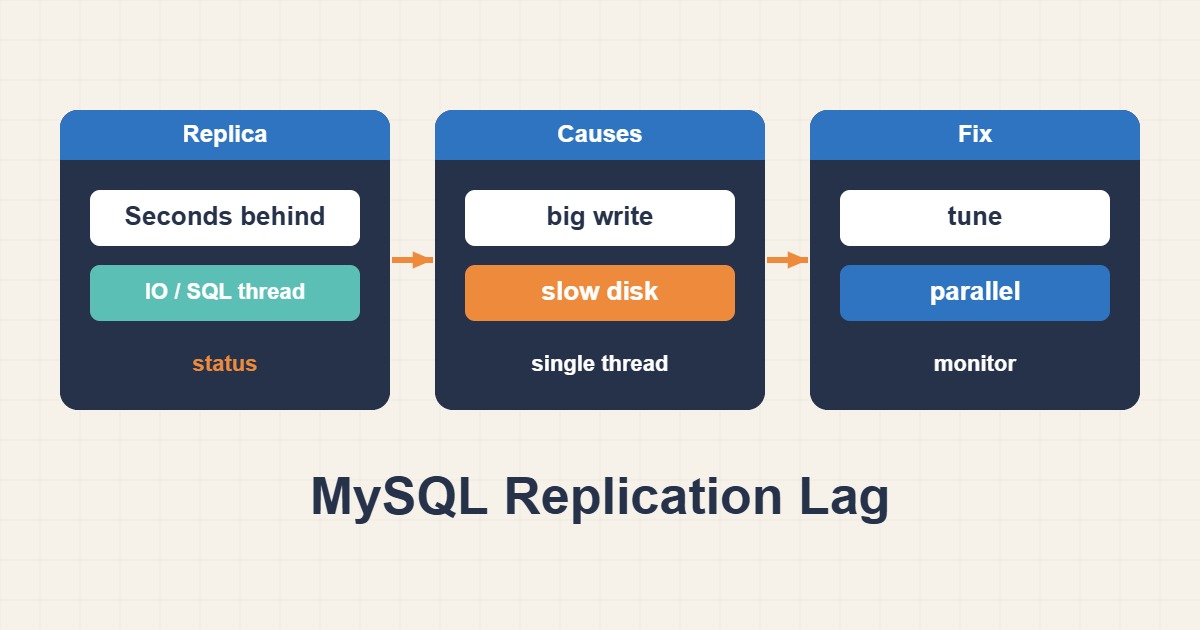
Replication lag means a replica is applying source transactions later than expected. Seconds_Behind_Source is only one signal; inspect receiver and applier threads, relay logs, large transactions, locks, CPU, and storage together.
Read the full replica status
Capture receiver/applier health, errors, GTID state, and relay-log backlog.
SHOW REPLICA STATUS\G
SELECT * FROM performance_schema.replication_connection_status\G
SELECT * FROM performance_schema.replication_applier_status_by_worker\G
Separate network lag from apply lag
An I/O-thread backlog points toward network or source delivery. A growing relay log with a slow SQL thread points toward queries, locks, or replica capacity.
Find large transactions and locks
DDL, bulk updates, backups, and long transactions can stall apply. Correlate replication status with InnoDB diagnostics.
SHOW ENGINE INNODB STATUS\G
SELECT * FROM information_schema.innodb_trx ORDER BY trx_started;
Measure replica resources
Check CPU, I/O wait, fsync latency, and buffer-pool pressure. An undersized replica often falls behind during peaks.
vmstat 1
iostat -xz 1
pidstat -dru 1
Recover without hiding errors
Do not skip transactions blindly. Verify the cause, data consistency, and GTID state, then monitor lag back to zero.
Replication lag checklist
- Inspect receiver and applier separately.
- Record relay backlog and errors.
- Find locks and large transactions.
- Measure CPU and storage latency.
- Verify consistency after recovery.
Frequently asked questions
Is Seconds_Behind_Source always accurate?
No. It can be NULL or misleading when threads stop or connectivity changes.
Do more parallel workers always help?
Only when transactions can apply in parallel and CPU or storage is not the real bottleneck.
Can read traffic cause lag?
Heavy reads can compete with the applier for CPU, buffer-pool pages, and storage I/O.
Related guides
Official documentation
Sources last reviewed: ۳۰ سپتامبر ۲۰۲۶