
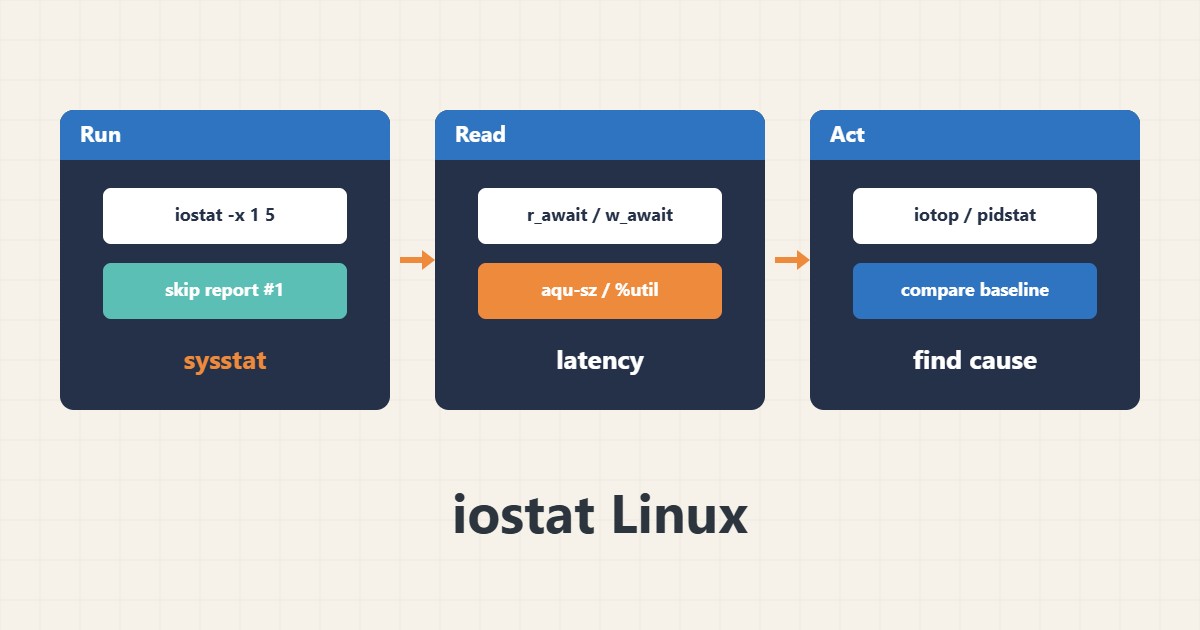
Sometimes CPU and memory look healthy while the site is still slow. The disk is then the prime suspect, and iostat -x shows latency and saturation per device. It ships in the sysstat package.
1. Run the command
After installing sysstat, run it with an interval and ignore the first report, which is an average since boot:
iostat -x 1 52. Key columns
r_await and w_await are average read and write latency in milliseconds. aqu-sz is the average request queue length and %util the share of time the device was busy. Column names differ slightly between sysstat versions, so check the man page of your version.
3. Interpreting %util
On SSD and NVMe devices that serve many requests in parallel, %util near 100 is not necessarily saturation. A better signal is rising latency and queue length together with real complaints about slowness.
4. Illustrative example, not a measurement
Suppose (an invented figure) w_await climbs from 2 to 40 ms while aqu-sz also grows. Writes are queuing up, so check heavy backups or logging.
5. Common mistakes
- Relying on %util alone for SSDs.
- Reading the first report as live data.
- Forgetting that a virtual disk may depend on shared host storage.
6. Frequently asked questions
What await value is good? There is no fixed number; compare it with the normal baseline of the same server.
How do I find which process uses the disk? Tools such as iotop or pidstat -d help.
7. Quick checklist
- Install sysstat.
- Run iostat -x 1 5.
- Compare await and aqu-sz with the normal baseline.
- Find the consumer with iotop or pidstat.
If you need help reviewing performance or maintaining a server, see the server management services.
More server and WordPress guides are collected in the article archive.