
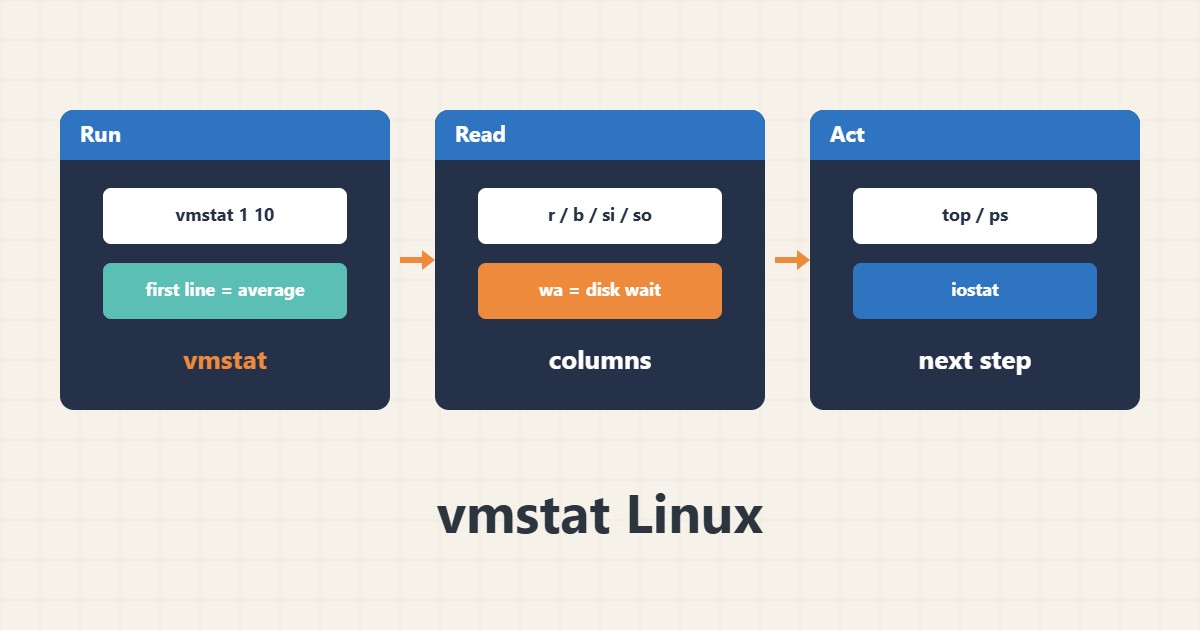
When a site slows down, take a quick snapshot of the server before guessing the cause. vmstat prints one line per second and shows whether the pressure comes from CPU, memory, swap or disk.
1. Run it correctly
The first line of vmstat is an average since boot and is useless for live troubleshooting. Always use an interval and ignore the first line:
vmstat 1 102. The columns that matter
r is the number of runnable processes and b the number blocked on I/O. If r stays above the CPU core count, the CPU is saturated. si and so are swap-in and swap-out; a sustained non-zero value signals memory pressure.
3. CPU and disk wait
wa is the share of time the CPU waits for disk. High wa together with high b usually points at storage or the database, not at a lack of processor power. us and sy show the split between applications and the kernel.
4. Illustrative example, not a measurement
Suppose (an invented number for illustration) r reads 8 on a 4-core server for several lines in a row while si/so stay at zero. The CPU queue is crowded, so look for the heavy process instead of adding RAM.
5. Common mistakes
- Reading the first line as the current state.
- Drawing conclusions from a single sample instead of several seconds.
- Treating low free memory as a shortage; Linux uses free memory for cache.
6. Frequently asked questions
Is a small si/so value a problem? Not if it is brief, but a sustained value means the server is swapping and memory use needs a look.
What do I run after vmstat? Use top or ps to find the offending process and iostat for disk details.
7. Quick checklist
- Run vmstat 1 10 and ignore the first line.
- Compare r with the core count.
- Check si and so for swapping.
- Look at wa and b for disk problems.
If you need help reviewing performance or maintaining a server, see the server management services.
More server and WordPress guides are collected in the article archive.