
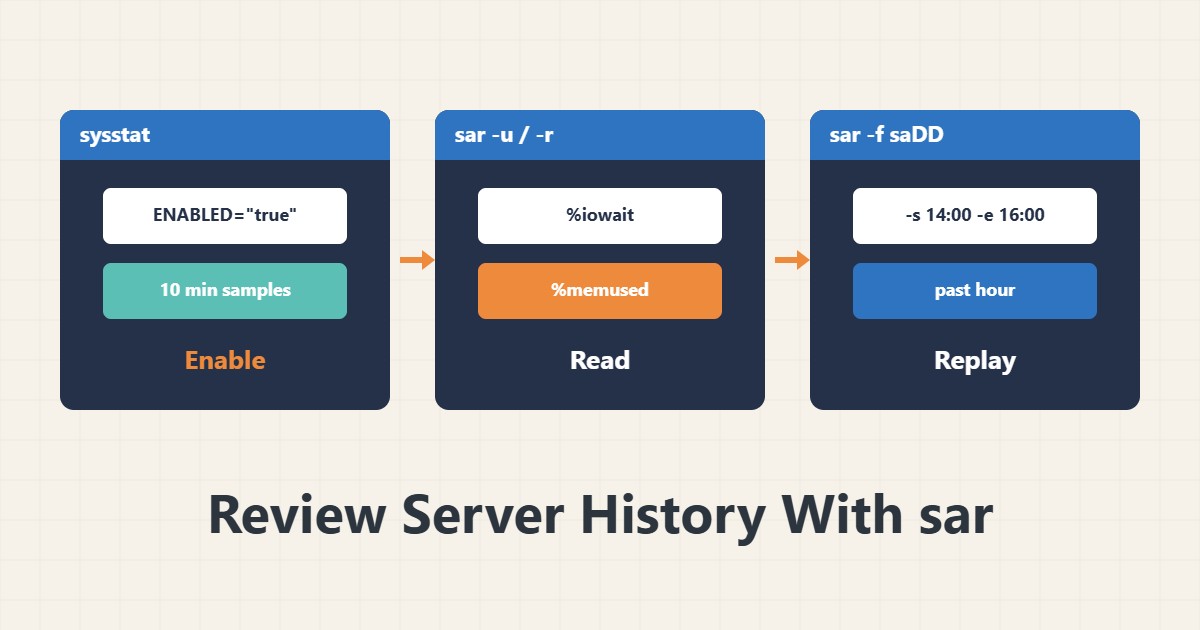
A server slowdown is usually noticed after it has gone. top shows only the present moment, while sysstat stores a sample every few minutes so you can go back in time. This guide covers setup, reading and limits.
1. Install and enable
sudo apt install sysstat
sudo sed -i 's/ENABLED="false"/ENABLED="true"/' /etc/default/sysstat
sudo systemctl enable --now sysstat
On Debian and Ubuntu you must turn collection on. RHEL-style distributions keep the files in another path. By default a sample is taken every 10 minutes.
2. Read today
sar -u        # CPU
sar -r        # memory
sar -q        # load and run queue
sar -b        # disk I/O
sar -n DEV    # network
The %iowait column in CPU output and %memused in memory output are usually the first clues.
3. Go back to a day and hour
sar -u -f /var/log/sysstat/sa05 -s 14:00:00 -e 16:00:00The file sa05 holds the fifth day of the month. Narrow the window with -s and -e. Default retention is about a month and can be changed in the sysstat configuration.
4. Interpreting it
If iowait was high during the slowdown, look at the disk; if free memory was low and swap active, see memory, swap and the OOM killer. If nothing was unusual, the slowness may come from the application or network, and the Nginx access log with response time helps.
5. Limits
A ten-minute interval means you will not see peaks lasting a few seconds. For continuous monitoring and alerts you need a separate monitoring tool; sar is for investigating after the fact.
6. Illustrative example, not a measurement
Suppose users reported slowness yesterday between 14:00 and 15:00. sar showed iowait climbing from near zero to a high value in that window, at the same time as a backup job. The numbers and scenario are invented for explanation, not a real measurement.
7. Common mistakes
- Installing sysstat without turning collection on.
- Looking at the wrong window because of the time zone.
- Expecting to see very short peaks.
- Drawing a conclusion from one column without comparing the others.
8. Frequently asked questions
Why is sar output empty? Collection may not be enabled, or no sample has been recorded yet.
Can I shorten the sampling interval? Yes, but data volume and load grow.
How does sar differ from top? top is instantaneous; sar keeps history.
9. Quick checklist
- sysstat is installed and enabled.
- sar -u and -r produce output.
- The slow hour was checked with -s and -e.
- iowait, memory and network were compared.
- Retention is suitable.
If you need help reviewing performance or maintaining a server, see the server management services.
More server and WordPress guides are collected in the article archive.