
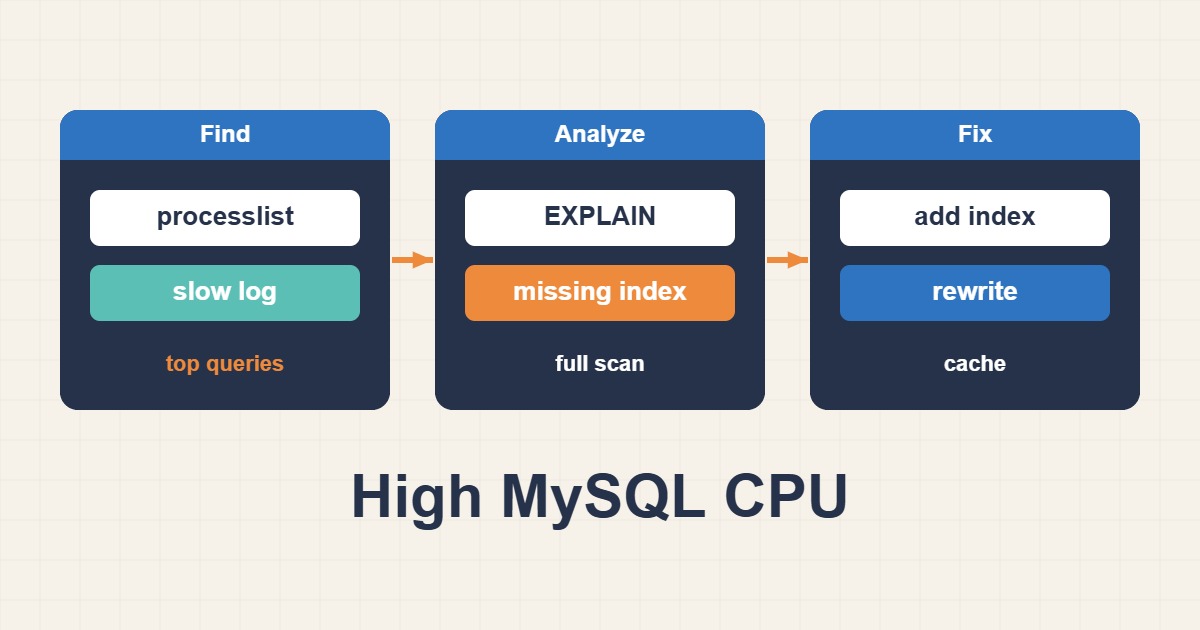
High CPU usage by MySQL is a symptom, not a diagnosis. It can be caused by one expensive query, thousands of individually cheap queries, missing indexes, lock contention, a changed execution plan, background maintenance, or workload growth. Restarting MySQL may clear active sessions, but it also destroys evidence and can create a recovery spike when caches warm again.
This guide provides a structured workflow for diagnosing high MySQL CPU on a production web server while minimizing risk.
Confirm that MySQL is really the CPU consumer
Start at the operating-system level. Check whether CPU is saturated, whether the pressure is user time, system time, or I/O wait, and whether another process is responsible:
uptime
top -H -p $(pidof mysqld)
vmstat 1 5
pidstat -p $(pidof mysqld) 1 5
iostat -xz 1 5
High user CPU with busy MySQL threads often points to query execution, sorting, aggregation, or decompression. High I/O wait suggests storage latency, insufficient caching, table scans, temporary-table activity, or competing disk workloads. A high load average alone does not prove a CPU bottleneck because blocked I/O tasks also contribute to load.
Capture the active workload before changing anything
Use a privileged diagnostic account and avoid exposing query text containing sensitive values:
SHOW FULL PROCESSLIST;
SHOW GLOBAL STATUS LIKE 'Threads_running';
SHOW GLOBAL STATUS LIKE 'Questions';
SHOW GLOBAL STATUS LIKE 'Slow_queries';
Look for repeated query patterns, long-running statements, many sessions in the same state, lock waits, and sudden concurrency. A process list is a momentary snapshot, so collect several samples. Do not kill all sessions as a first response; identify the responsible workload and understand whether a transaction rollback could itself be expensive.
Use the slow query log deliberately
MySQL defines slow queries using long_query_time and related criteria. The slow query log is valuable because it records candidates for optimization over time rather than showing only what is active at one instant.
SHOW VARIABLES LIKE 'slow_query_log';
SHOW VARIABLES LIKE 'slow_query_log_file';
SHOW VARIABLES LIKE 'long_query_time';
SHOW VARIABLES LIKE 'min_examined_row_limit';
Enable or adjust it carefully according to your operational standards. A temporary lower threshold can reveal frequent sub-second queries that consume large aggregate CPU, but it also increases log volume. Protect disk space, permissions, rotation, and data retention. Use mysqldumpslow or a suitable analysis tool to group similar statements and rank them by total time, average time, or rows examined.
Rank queries by total impact, not only duration
A query taking five seconds once per day may matter less than a 50-millisecond query executed thousands of times per minute. Performance Schema and the sys schema can reveal aggregate workload. Depending on MySQL version and configuration, useful summaries include statement digests ordered by total latency, execution count, rows examined, or temporary-table activity.
SELECT DIGEST_TEXT, COUNT_STAR,
       ROUND(SUM_TIMER_WAIT/1000000000000,2) AS total_seconds,
       SUM_ROWS_EXAMINED, SUM_ROWS_SENT
FROM performance_schema.events_statements_summary_by_digest
ORDER BY SUM_TIMER_WAIT DESC
LIMIT 10;
Digest text normalizes literal values, making it easier to see query families. Performance Schema has memory and instrumentation costs, so use the existing configuration and official documentation rather than enabling every consumer indiscriminately.
Inspect execution plans with EXPLAIN
Once a costly query is identified, run EXPLAIN against the same schema and representative predicates. Review access type, selected indexes, estimated rows, join order, and extra operations such as temporary tables or filesort.
EXPLAIN SELECT ...;
EXPLAIN FORMAT=JSON SELECT ...;
EXPLAIN ANALYZE executes the statement and reports actual timing on supported MySQL versions. Because it runs the query, use it only when execution is safe and preferably on a replica or staging environment for expensive statements. Estimated and actual row-count differences can reveal stale statistics or data-distribution problems.
Evaluate indexes in the context of the query
A missing index is common, but adding an index to every filtered column is not a sound strategy. Composite index order should reflect equality predicates, ranges, joins, ordering, and grouping. An index that helps reads also consumes storage and adds overhead to INSERT, UPDATE, and DELETE operations.
Check:
- whether join columns use compatible data types and collations;
- whether functions applied to indexed columns prevent efficient access;
- whether leading wildcard searches require a different search approach;
- whether a composite index matches the leftmost columns used by the query;
- whether the query retrieves far more rows or columns than the application needs.
Remove duplicate or unused indexes only after workload analysis, backups, and a rollback plan.
Check temporary tables, sorts, and memory assumptions
Large GROUP BY, ORDER BY, DISTINCT, and UNION operations may create internal temporary tables. Monitor status counters and statement summaries instead of globally increasing memory limits. Per-connection buffers multiplied by high concurrency can exhaust RAM.
SHOW GLOBAL STATUS LIKE 'Created_tmp%';
SHOW GLOBAL STATUS LIKE 'Sort%';
SHOW VARIABLES LIKE 'tmp_table_size';
SHOW VARIABLES LIKE 'max_heap_table_size';
If temporary tables spill to disk, first optimize the responsible queries and indexes. Raising limits globally can trade disk activity for memory pressure and trigger the OOM killer during traffic spikes.
Look for locks and long transactions
Lock contention may present as high latency even when CPU is not fully saturated, and retry loops can then increase CPU. Inspect InnoDB transaction and lock information available in your MySQL version. Long-running transactions can retain old row versions, delay purge, and block schema changes.
SHOW ENGINE INNODB STATUS\GFind the application path responsible before terminating a transaction. A large rollback can take considerable time and I/O. Also verify that the application commits promptly and does not keep transactions open while waiting on external services.
Check configuration only after measuring workload
The InnoDB buffer pool is important, but a universal percentage is not appropriate for every server. A dedicated database server, a combined web/database host, and a container with a strict memory limit require different allocations. Measure dataset size, working set, cache hit behavior, memory pressure, swap activity, and peak connections.
Other variables such as connection limits, table caches, redo capacity, and thread behavior should be reviewed in context. Avoid copying a generic configuration from a tuning script without understanding the workload and MySQL version.
Correlate the database spike with the application
For WordPress and other web applications, map query spikes to request logs, background jobs, cron tasks, imports, reports, crawlers, or plugin changes. Check deployment times and traffic sources. Object caching can reduce repeated reads, but it should not hide an unbounded query or missing index. Rate limiting abusive endpoints and moving heavy reports to asynchronous jobs can be more effective than increasing database resources.
A safe incident workflow
- Record the incident window and preserve OS, MySQL, and application metrics.
- Confirm whether CPU, I/O, memory, or locks are the primary constraint.
- Capture repeated process-list samples and top statement digests.
- Use slow-query data to rank query families by total impact.
- Review EXPLAIN output and validate candidate indexes in staging.
- Apply one controlled change with a rollback plan.
- Compare latency, CPU, rows examined, and error rates after the change.
- Keep monitoring long enough to cover the original peak period.
Conclusion
Reliable MySQL performance work is evidence-led. Start with system metrics, capture the active workload, use the slow query log and Performance Schema to rank impact, and then validate execution plans and indexes. Scaling CPU or memory may be justified after optimization, but it should not replace diagnosis.
References: MySQL Slow Query Log and Using Performance Schema to Diagnose Problems.